Overview
HealthHub includes reporting capabilities to help you understand how your site visitors (called “users”) use your site, the amount of user traffic on each of your articles, and basic geographic information of user activity. This information provides insight into which topics users are most interested in and where they are located geographically, so you can focus engagement efforts on what users want most.
HealthHub reporting exports
Please reach out to your account representative for an export of reports for your site. See below for the available reports
What's in a HealthHub report
HealthHub reports are generated and exported as a single PDF file. The PDF contains 5 reports:
- Overview report
- Monthly Trends report
- Users by Page report
- Geographic Overview report
- Site Searches by User report
Overview report
The Overview report presents user activity data during a set time frame at a high level.
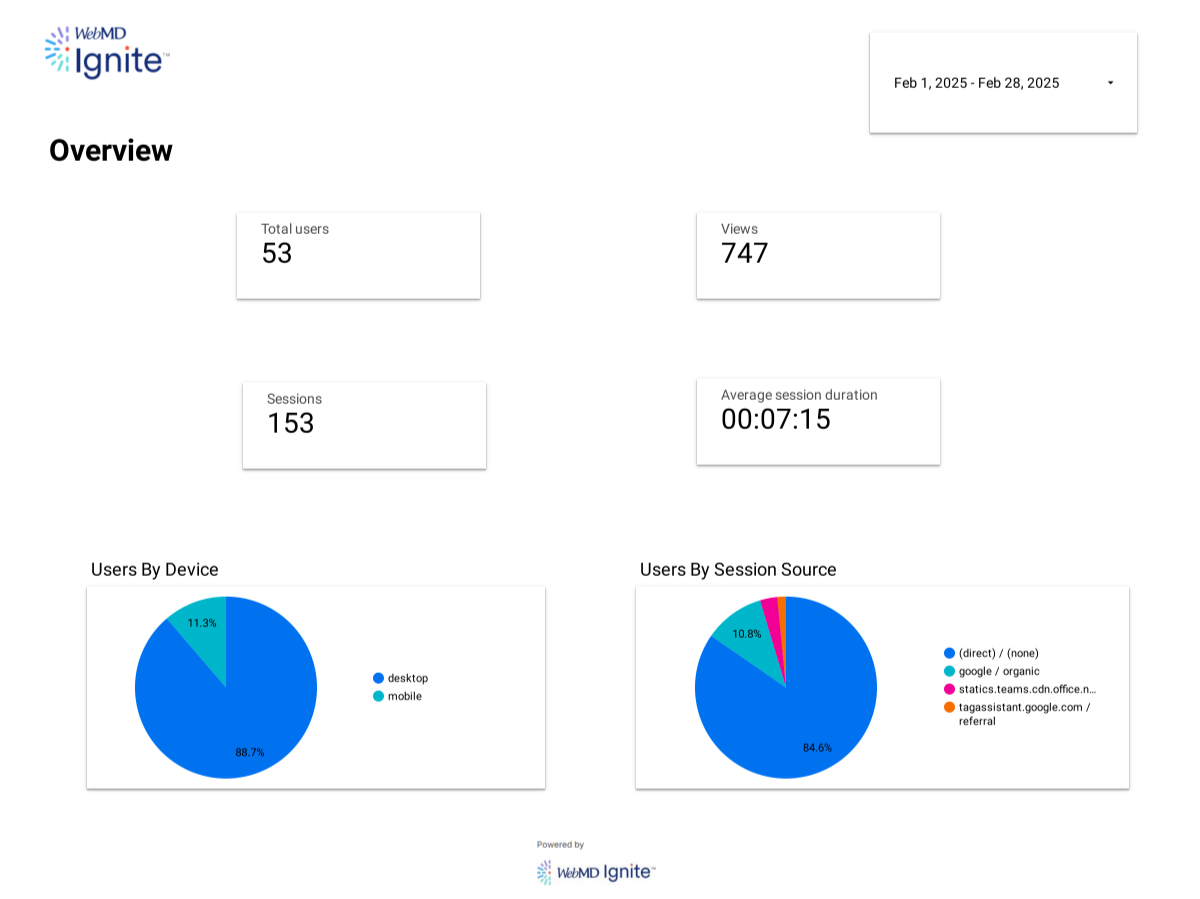
This report includes:
- Total users: Total number of unique users to your HealthHub site.
- Views: Total combined number of page views of all HealthHub pages and articles by all users.
- Sessions: Total number of times a user has entered your HealthHub site on any page.
- Sessions are counted when a user navigates to anywhere in your site from outside your site (including from a blank or new browser tab). Users navigating from one page in your site to another are considered part of a single session.
- Sessions are not per unique user; if the same user has 2 separate sessions within the report time frame, 2 sessions will count toward this total.
- A session ends when a user navigates away from your HealthHub site, closes the browser tab, or after 30 minutes of inactivity.
- Average session duration: The average amount of time users spend on your HealthHub site per session.
- Users By Device: A pie chart illustrating the percentage of users who visited your site using different devices, such as desktop or mobile.
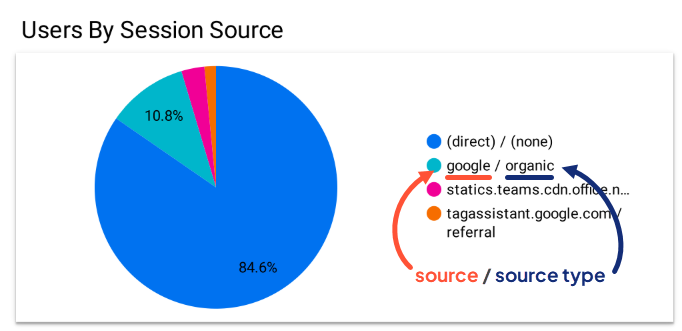
- Users By Session Source: A pie chart illustrating the percentage of sessions grouped by how each session started.
- Examples:
- direct: The session began when a user opened a browser and navigated to your site themselves. They may have clicked a bookmark or entered a URL manually.
- google: The session began when a user clicked a Google search result.
- statics.teams.cdn.office.net: The session began when a user clicked a link to your HealthHub site that was placed in a Microsoft Teams environment.
- Each source displays a source type after a forward slash. This helps categorize how the traffic originated. Examples:
- none: The user navigated to your site on their own.
- organic: The user navigated to your site by clicking a search engine result. There was no paid advertising or campaign associated with the link.
- referral: The user entered your site from a link on another site.
- Examples:
Monthly Trends report
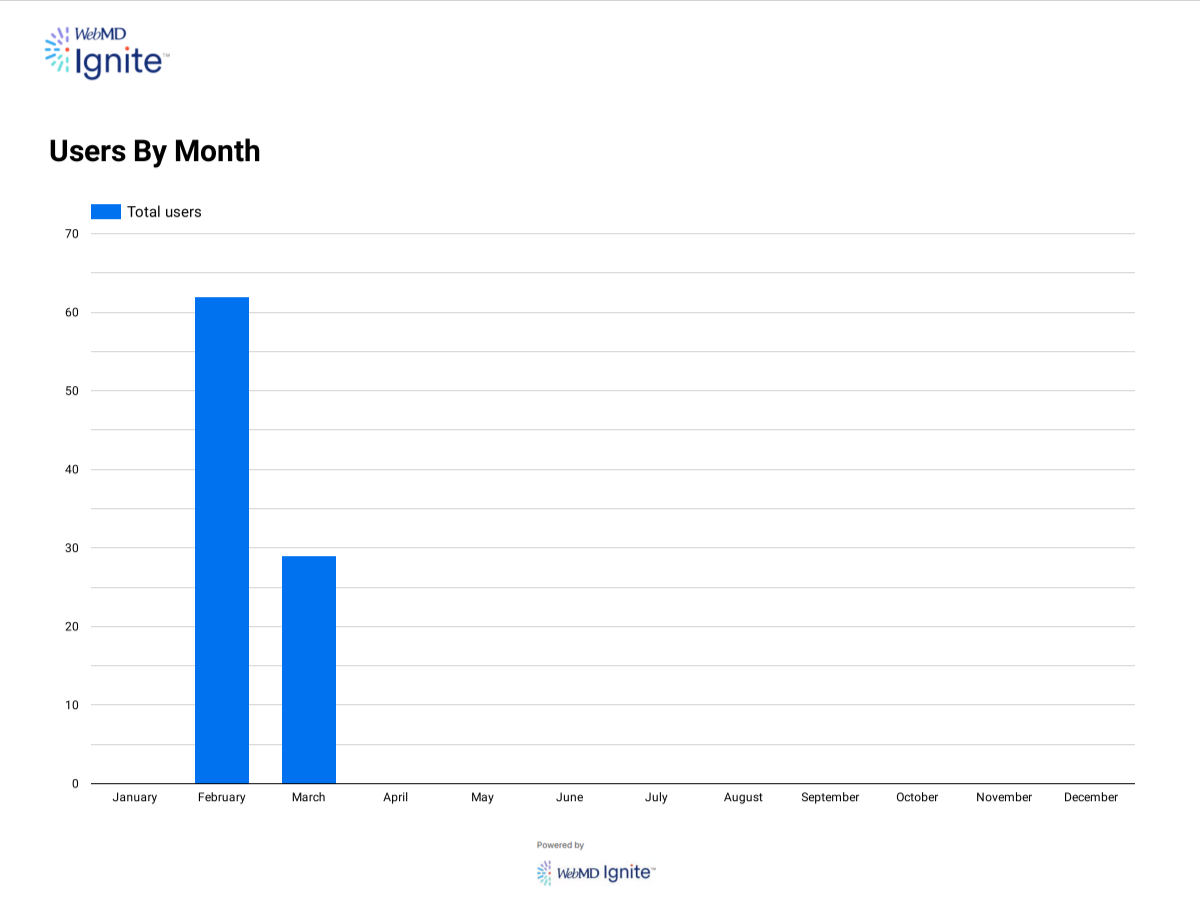
The Monthly Trends report shows the total number of unique users that visit your site over time. It displays a bar chart showing the total number of visitors per month over the course of the current year.
Users by Page report
This report shows a list of pages that were visited in the set date range.
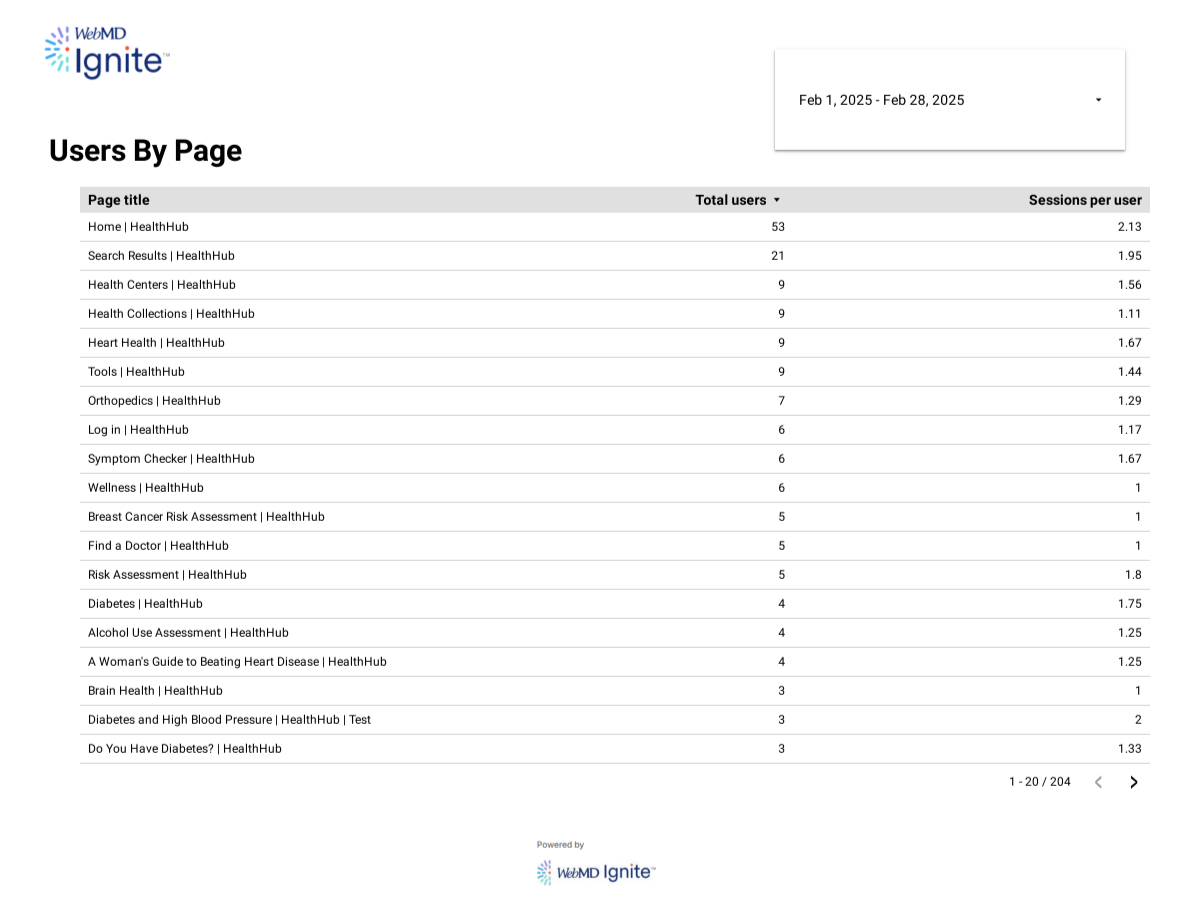
The list of pages has 3 headers:
- Page title: The title of each page.
- Total Users: The total number of unique users that visited each page in the set time frame.
- Sessions per user: The average number of times each user visited a page in the set time frame.
Geographic Overview report
The Geographic Overview report displays geographic locations where users were when they visited your HealthHub site, during a given date range.
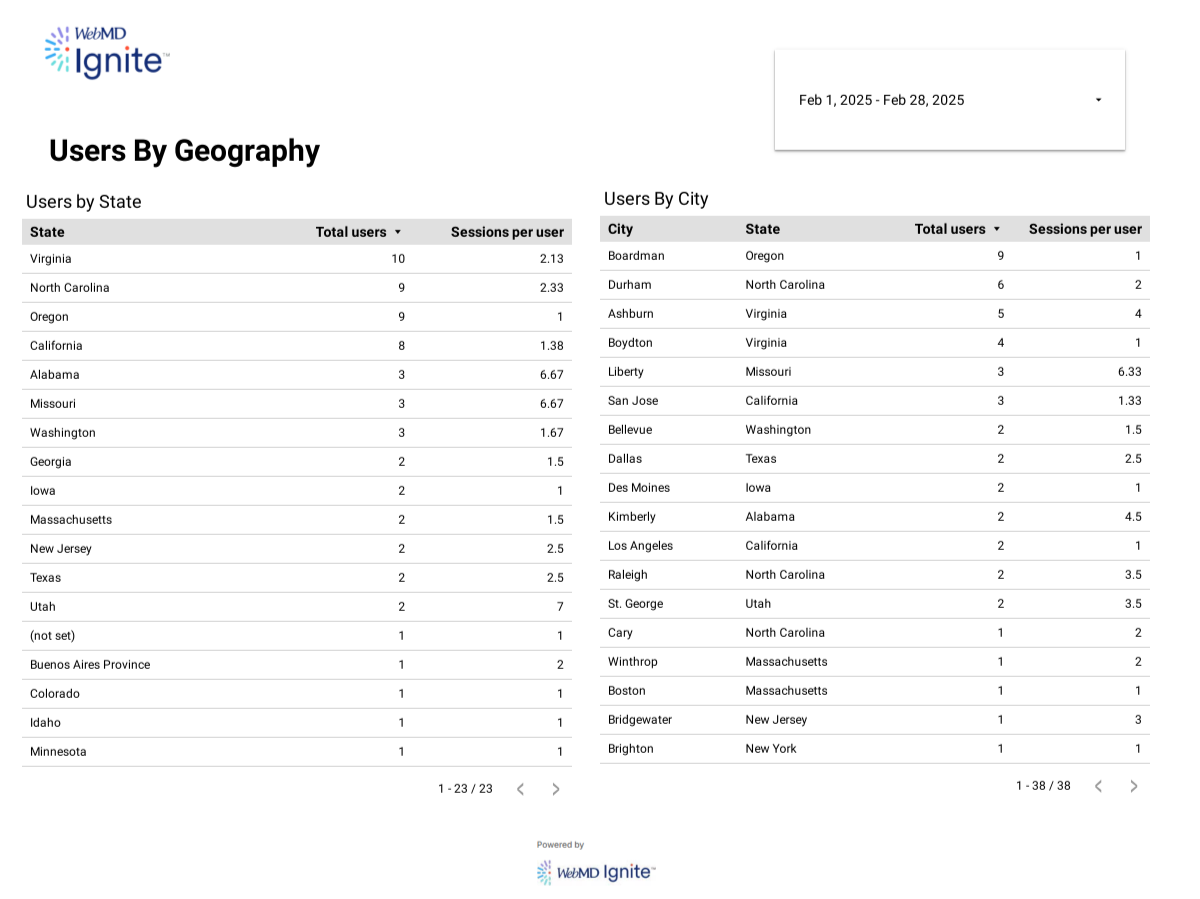
This report shows 2 lists, each with 3 data points:
- Users by State This list displays the general regions that your site has been visited from. These will typically be US states but can be from outside of the country as well.
- Region: The name of the state or province.
- Total users: The total number of unique users that visited your site in the date range from that state or province.
- Sessions per user: The average number of individual sessions that each user from that region had in your site in the given date range. See the definition of a session in the Overview report section.
- Users by City: This list displays the cities that your site has been visited from. These will typically be US cities, but can be from other countries.
- City: The name of the city.
- Total users: The total number of unique users that visited your site in the date range from that city.
- Sessions per user: The average number of individual sessions that each user from that city had in your site in the given date range. See the definition of a session in the Overview report section.
Site Searches by User report
The Site Searches By User report displays a list of the search keywords entered in the site search input field in your HealthHub site.
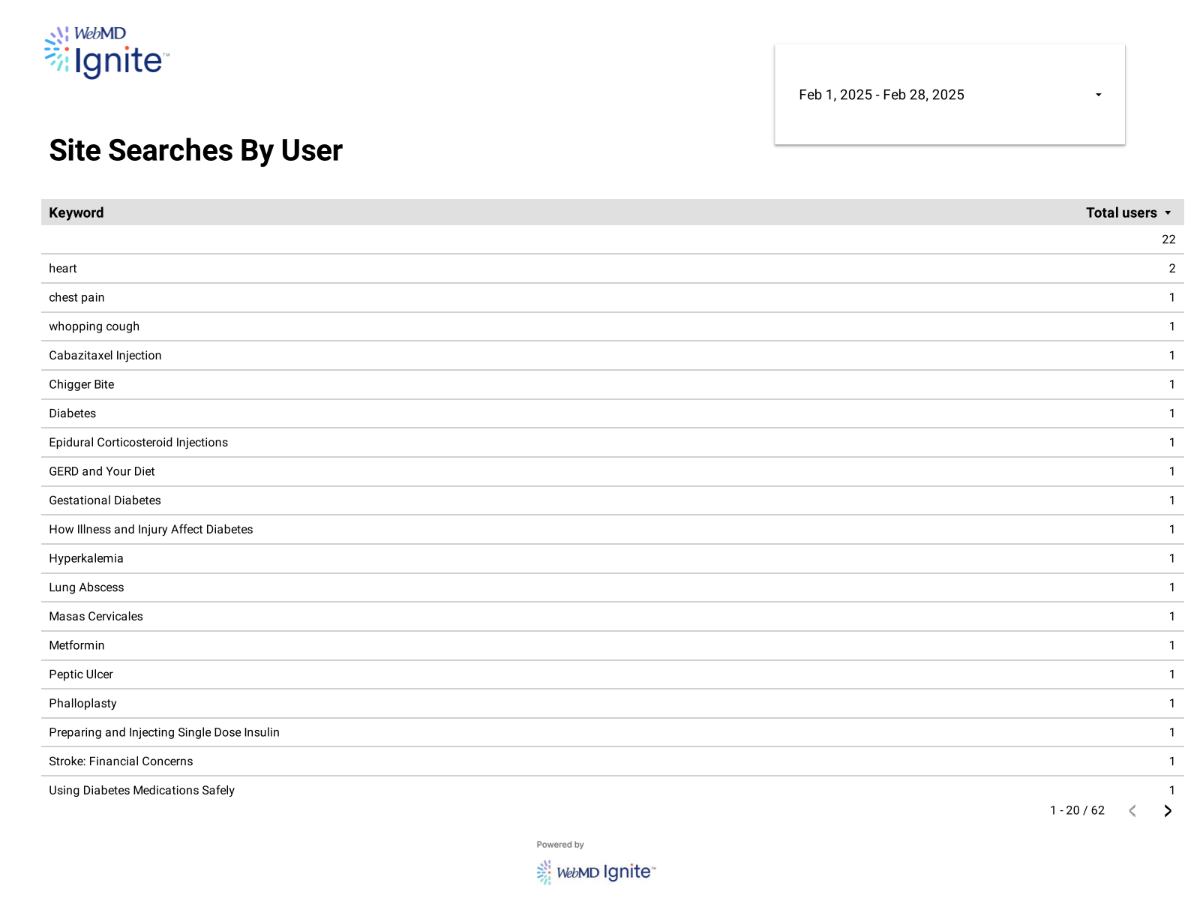
The list includes:
- Keyword: The keyword or search term entered.
- Total users: The total number of unique users that entered each keyword or search term into your site search.

